Advanced Usage
You’ll find advanced ways of using Felicien.
TSDB Authentication
FeliConnector is based on Requests to communicate with the TSDB. As such, it allows to pass Requests parameters to the FeliConnector constructor, to be used in all the HTTP requests. For example, this is how you can authenticate your calls to the TSDB:
>>> from requests.auth import HTTPBasicAuth
>>> tsdb = FeliConnector(url="http://victoriametrics:8428", tsdb="victoriametrics", options={"auth": HTTPBasicAuth("foo", "bar")})
In all the calls to the TSDB, the option auth=HTTPBasicAuth("foo", "bar") will be used.
TLS Management
Just like the Authentication, you can pass Requests TLS configuration to the FeliConnector constructor.
TLS Verification
You can pass a CA_BUNDLE file, to verify the server certificate with your prefered trusted CA:
>>> tsdb = FeliConnector(url="http://victoriametrics:8428", tsdb="victoriametrics", options={"verify": "/path/to/certfile"})
Or you can disable TLS verification:
>>> tsdb = FeliConnector(url="http://victoriametrics:8428", tsdb="victoriametrics", options={"verify": False})
Client certificates
You can also use a client certificate:
>>> tsdb = FeliConnector(url="http://victoriametrics:8428", tsdb="victoriametrics", options={"cert": ('/path/client.cert', '/path/client.key')})
Apply changes to timeserie
You may want to produce your own timeserie, and push it to a TSDB.
Let’s start by creating your own FeliTS object:
>>> import pandas as pd
>>> import math
>>> idx = pd.DatetimeIndex([pd.to_datetime(1710231704+x*60, unit="s") for x in range(2880)])
>>> ser = pd.Series(data=[math.cos(math.radians(x)) for x in range(2880)], index=idx)
>>> ts = FeliTS(name="mymetric", labels={"mylabel": "myvalue"}, values=ser)
>>> ts
FeliTS(mymetric{mylabel:"myvalue"}, 2880 datapoints)
This metric could be pushed to the TSDB via a FeliConnector object:
>>> tsdb = FeliConnector(url="http://victoriametrics:8428", tsdb="victoriametrics")
>>> tsdb.import_timeserie(ts=ts)
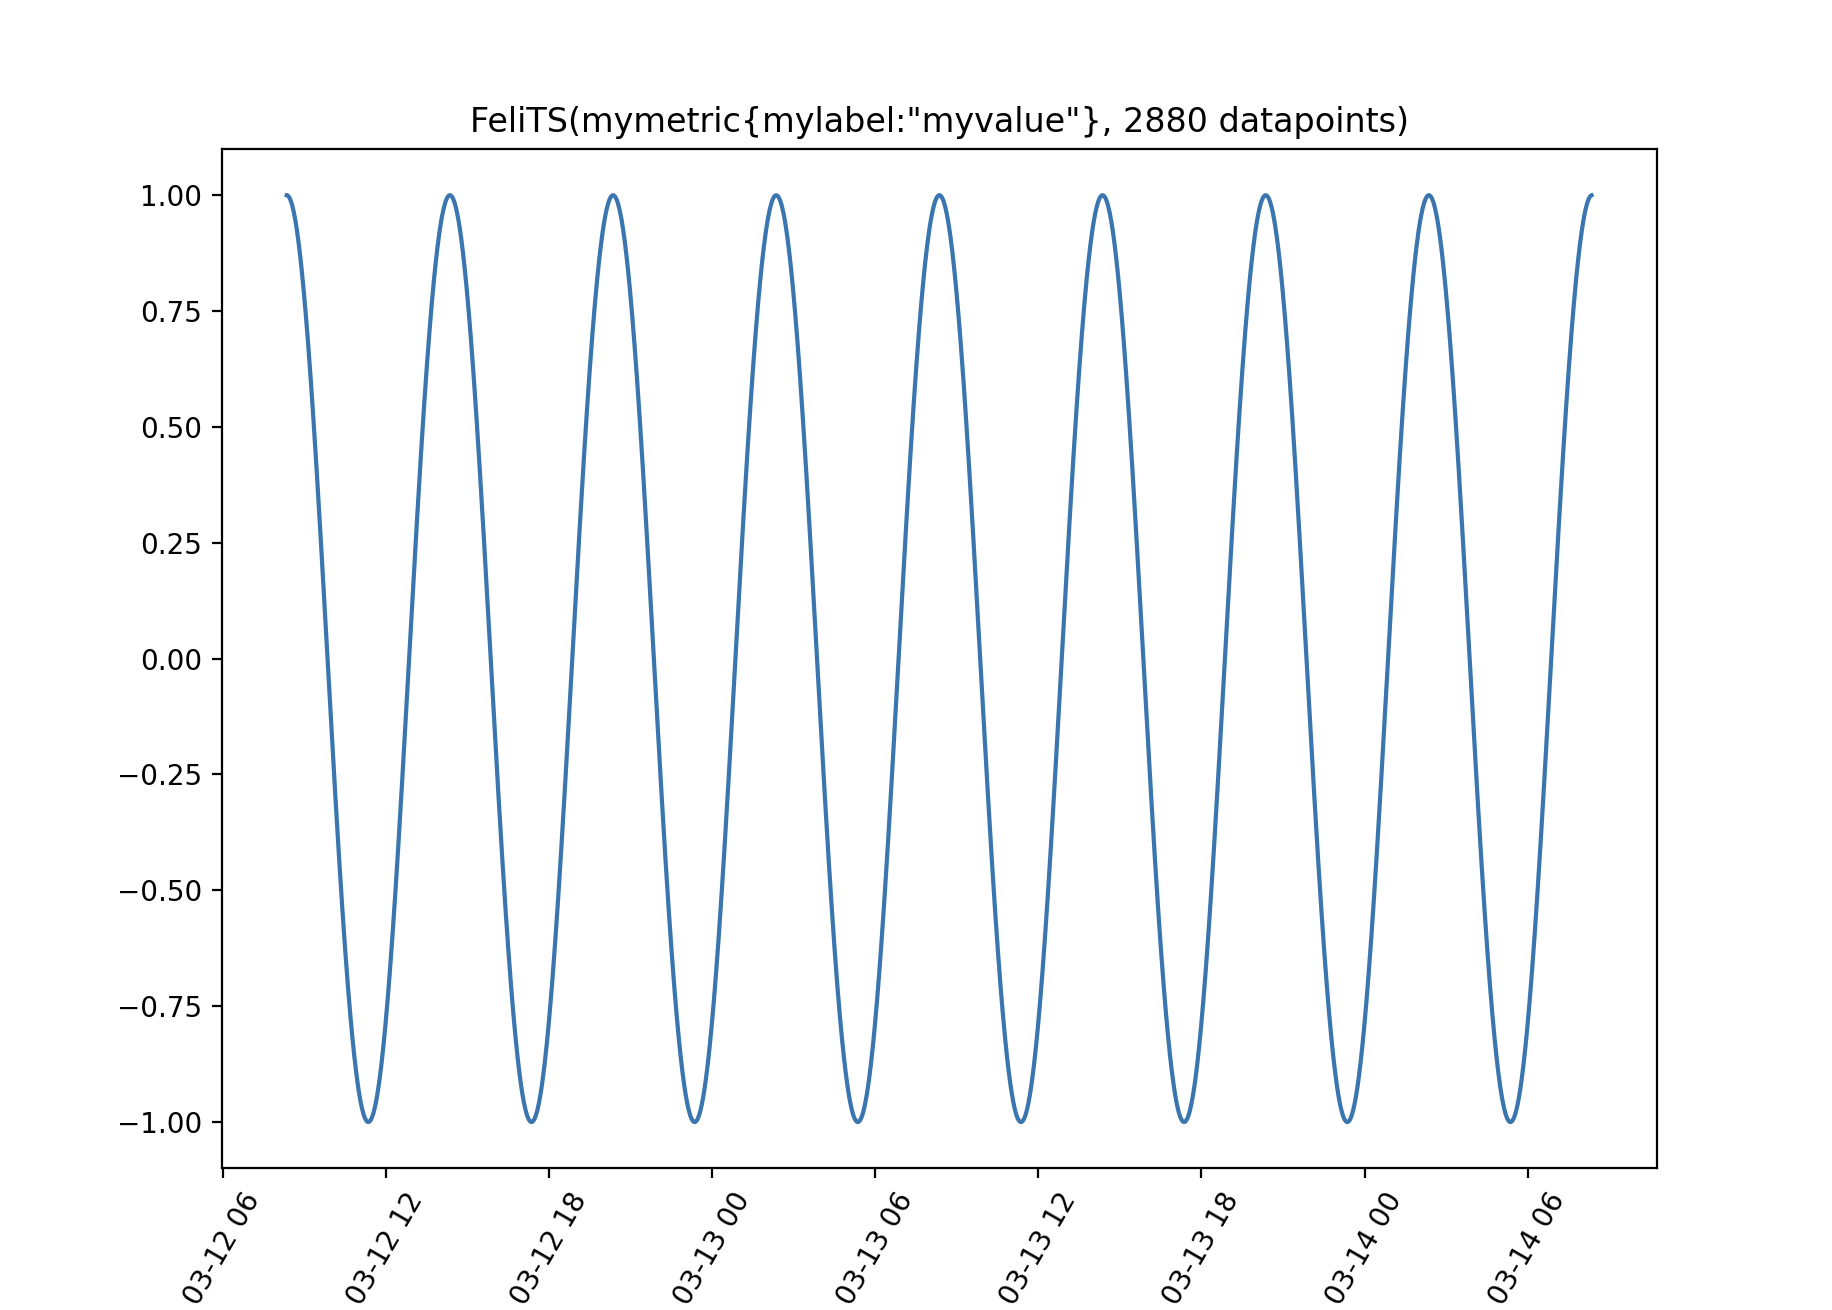
Plotting the timeserie
You may need a visual representation of your metric (using Matplotlib):
>>> import pandas as pd
>>> import math
>>> idx = pd.DatetimeIndex([pd.to_datetime(1710231704+x*60, unit="s") for x in range(2880)])
>>> ser = pd.Series(data=[math.cos(math.radians(x)) for x in range(2880)], index=idx)
>>> ts = FeliTS(name="mymetric", labels={"mylabel": "myvalue"}, values=ser)
>>> ts.plot()
This should open a window:
TSDB type
When creating your FeliConnector object, you can specify the TSDB type (so that the URLs to access the different endpoints are localized).
Possible values are:
prometheusvictoriametrics
Note
Only single-node victoriametrics is currently supported. The cluster version uses different API endpoint, and is not currently compatible.
Timeserie normalization
Sometimes, your timeserie is not exactly based on regular frequency (for instance, some points are missing). You can normalize the timeserie:
>>> a = FeliTS(name="foo", values=pd.Series(
        data=[1, 1, 1, 1, 1],
        index=pd.to_datetime(
            [
                1435781430.781,
                1435781445.781,
                1435781460.781,
                1435781475.781,
                1435781489.781,
            ],
            unit="s",
        ),
    ))
>>> a.data
2015-07-01 20:10:30.780999899    1
2015-07-01 20:10:45.780999899    1
2015-07-01 20:11:00.780999899    1
2015-07-01 20:11:15.780999899    1
2015-07-01 20:11:29.780999899    1
dtype: int64
>>> a.frequency
Timedelta('0 days 00:00:15')
>>> a.normalize()
2015-07-01 20:10:30.780999899    1
2015-07-01 20:10:45.780999899    1
2015-07-01 20:11:00.780999899    1
2015-07-01 20:11:15.780999899    1
Freq: 15s, dtype: int64
Warning
This function is destrucive! It means that, as shown in the example above, if a point is not exactly aligned on the frequency, it will be dropped. In case of a missing point, one NaN value will be added.
Continuous segment
Even if you can normalize the timeserie, holes in the timeserie are painful to deal with. You might want to extract continuous segments from your timeserie, i.e. a segment with all the points aligned on the frequency:
>>> a = FeliTS(name="foo", values=pd.Series(
        data=[1, 1, 1, 1, 1],
        index=pd.to_datetime(
            [
                1435781430.781,
                1435781445.781,
                1435781460.781,
                1435781475.781,
                1435781491.781,
            ],
            unit="s",
        ),
    ))
>>> a.data
2015-07-01 20:10:30.780999899    1
2015-07-01 20:10:45.780999899    1
2015-07-01 20:11:00.780999899    1
2015-07-01 20:11:15.780999899    1
2015-07-01 20:11:31.780999899    1
dtype: int64
>>> a.continuous_segment()
2015-07-01 20:10:30.780999899    1
2015-07-01 20:10:45.780999899    1
2015-07-01 20:11:00.780999899    1
2015-07-01 20:11:15.780999899    1
dtype: int64
In case there are multiple segments, you can choose the one you want using the position parameter. See longest_continuous_segment.
You can also choose between any segment, or the longest segment with the longest parameter (False by default).
Warning
This function longest_continuous_segment is deprecated, and shouldn’t be used. One might prefer using continuous_segment, and use the parameter longest to extract the longest segment.